Lifetime Likelihood of a $100,000 year for U.S. Real Estate Agents
This report evaluates the likelihood that individuals entering residential real estate sales will achieve at least one year with earnings exceeding $100,000. By synthesizing cross-sectional income distributions from National Association of REALTORS® (NAR), labor market data from the U.S. Bureau of Labor Statistics (BLS), tax-based evidence from the Internal Revenue Service (IRS), and longitudinal insights from MLS-based academic studies, this report constructs a probabilistic estimate of lifetime six-figure attainment.
Our conclusion is that most people who enter residential real estate and seriously try to make it will never have a single year earning $100,000 or more. A reasonable estimate is that about 60–80% fall short on a gross income basis, and about 65–85% on a net income basis, with the most likely outcome sitting around 70% (gross) and the mid-70s (net).
Data Landscape
Why there has been no clean national research on Lifetime Success of Agents
The answer to our question requires longitudinal, person-level earnings histories for agents. Public sources fall short in different ways:
U.S. Bureau of Labor Statistics OEWS provides wage percentiles for employees, but explicitly notes the estimates do not include self-employed workers, and real estate brokers/sales agents are often self-employed.
BLS OOH provides helpful occupational context (self-employment share, commission structure, irregular earnings) but does not provide longitudinal distributions.
Internal Revenue Service SOI tables describe sole proprietorship income statements by industry category, but the relevant row groups “offices of real estate agents, brokers, property managers, and appraisers,” and is not a clean occupation roster.
Survey microdata such as CPS/ACS can be linked in restricted settings, but public-use versions do not naturally yield decades-long career panels for agents, and measurement problems are substantial for self-employed earnings.
What state licensing boards and MLS organizations typically can and cannot provide
State real estate commissions/boards generally track licensing counts and compliance, not income distributions, and MLS organizations track transactions but not comprehensive net income. This is why rigorous longitudinal evidence tends to appear in academic work using proprietary MLS panels rather than in official “agent income panel” publications.
Methodology
While no public, national dataset directly answers what share of U.S. real estate agents never earn $100,000 in a year over their careers, we can construct scenario-based models to estimate the probability that an entrant to the profession ever reaches $100,000 in a year. To do this we’ve used the strongest, closest evidence of official earnings sources based on a combination of:
Income Distribution: Cross-sectional income distributions for practicing agents (especially National Association of REALTORS® member income bins by experience for calendar year 2024).
Exit/Churn Rates: Longitudinal MLS-based panels that show unusually high entry/exit churn among inexperienced agents and strong persistence/stratification (the same top agents repeatedly outperform).
Pay Structure: Official context showing that agents’ pay is typically commission-based, often irregular, and the workforce includes both full-time and part-time participants.
Exploring Variations of Defined Income
Estimates of Gross Personal Income
Using 2024 NAR data on how many agents (by experience level) make $100k+ as the yearly probability of success, and combining that with real MLS-based data on how long agents stay in or leave the business, we can come up with three possible scenarios:
Optimistic scenario (low churn, low persistence): ~58% “never hit $100k” within 30 years
Central scenario (moderate churn, moderate persistence): ~69% “never hit $100k” within 30 years
Conservative scenario (higher churn, strong persistence/stratification): ~78% “never hit $100k” within 30 years
It’s worth noting that these results apply most naturally to a population “like NAR members/practicing agents,” but not necessarily all licensees.
Estimates of Actual Take-Home-Pay
What if by $100,000 we mean net taxable business income? This is the actual profit, or take-home-pay, after expenses. The threshold becomes meaningfully harder. With an explicit proxy conversion from NAR gross-income bins (assumptions stated later), central 30-year “never” estimates rise to roughly:
~72% (if expenses average ~15% of gross personal income)
~73% (20%)
~77% (30%)
Because business costs, splits, and deductibility differ widely by agent and brokerage model, these net results should be treated as a scenario range rather than a single point estimate.
What Longitudinal Research Implies about Outcomes
Two recurring facts in the longitudinal literature matter to discover however many agents ever hit $100k:
Early-Career Churn is very High
In a large MLS-based panel study by Sonia Gilbukh and Paul Goldsmith-Pinkham (National Bureau of Economic Research working paper), exit rates are “concentrated among inexperienced agents,” with inexperienced exit rates “near 30 percent,” while exit rates for very experienced agents “dip below 5 percent.”Their definitions illustrate a key measurement nuance: “active” agents are those with at least one listing or buyer-side sale in a year, and “exit” is defined as being active this year and inactive in the following two years.
Performance is Persistent and Highly Stratified
In a well-known MLS panel study of Greater Boston by Panle Jia Barwick and Parag A. Pathak, the authors report that (for their cohort-based commission grouping) top-quartile agents “consistently earn $100,000 or more for most years,” and bottom-quartile agents “barely earn $30,000.”They also show stark differences in exit behavior by earnings tier: about three-quarters of agents in the bottom quartile exit at some point over the 10-year period they analyze, highlighting strong selection and persistence dynamics.
These two facts jointly push the number of agents who never hit $100K upward for an entry cohort:
Many agents exit before reaching the experience levels where $100k years are more common.
Outcomes are not random; rather, a subset is repeatedly high-performing while another subset is persistently low/episodic.
Anchoring the $100,000 Threshold with Cross-sectional Inputs
NAR Income Bins by Experience
NAR reports “gross personal income” distribution by experience in real estate. For $100k+ (gross personal income) in 2024:
≤2 years: 3% ($100–$149k) + 2% ($150k+) = 5%
3–5 years: 7% + 8% = 15%
6–15 years: 17% + 20% = 37%
16+ years: 14% + 27% = 41%
NAR also shows how the workforce composition changes with experience and participation intensity. For example, NAR reports that 89% are independent contractors overall (93% among ≤2 years), and that “real estate is only occupation” rises with experience (48% among ≤2 years; 81% among 16+).
Methodologically, NAR reports an adjusted response rate of 2.1% and notes weighting to state-level membership; the income measures refer to calendar year 2024.
BLS Percentiles
BLS describes the occupation as heavily commission-based and often irregular, noting agents can go weeks or months without a sale, and that some work part time.
BLS also reports that self-employed workers account for 54% of jobs for brokers and for sales agents (OOH).
OEWS (employee-only) percentiles show that $100k is above the 75th percentile for employee sales agents ($81,460) and around the 75th percentile for employee brokers ($98,060), but OEWS explicitly excludes self-employed workers.
IRS Schedule C aggregates (net-income reality check)
IRS SOI (Sole Proprietorship Returns, Tax Year 2022) reports, for the category “Offices of real estate agents, brokers, property managers, and appraisers,” approximately:
Number of returns: 1,078,611
Business receipts: 76,936,770 (thousands of dollars)
Net income less deficit: 30,074,512 (thousands of dollars)
Because the row bundles multiple related activities and does not provide percentiles, it cannot directly yield a share to ever hit $100k, but it reinforces that net income differs materially from gross receipts and that averages can mask extreme skewness.
Modeling Framework and Explicit Assumptions
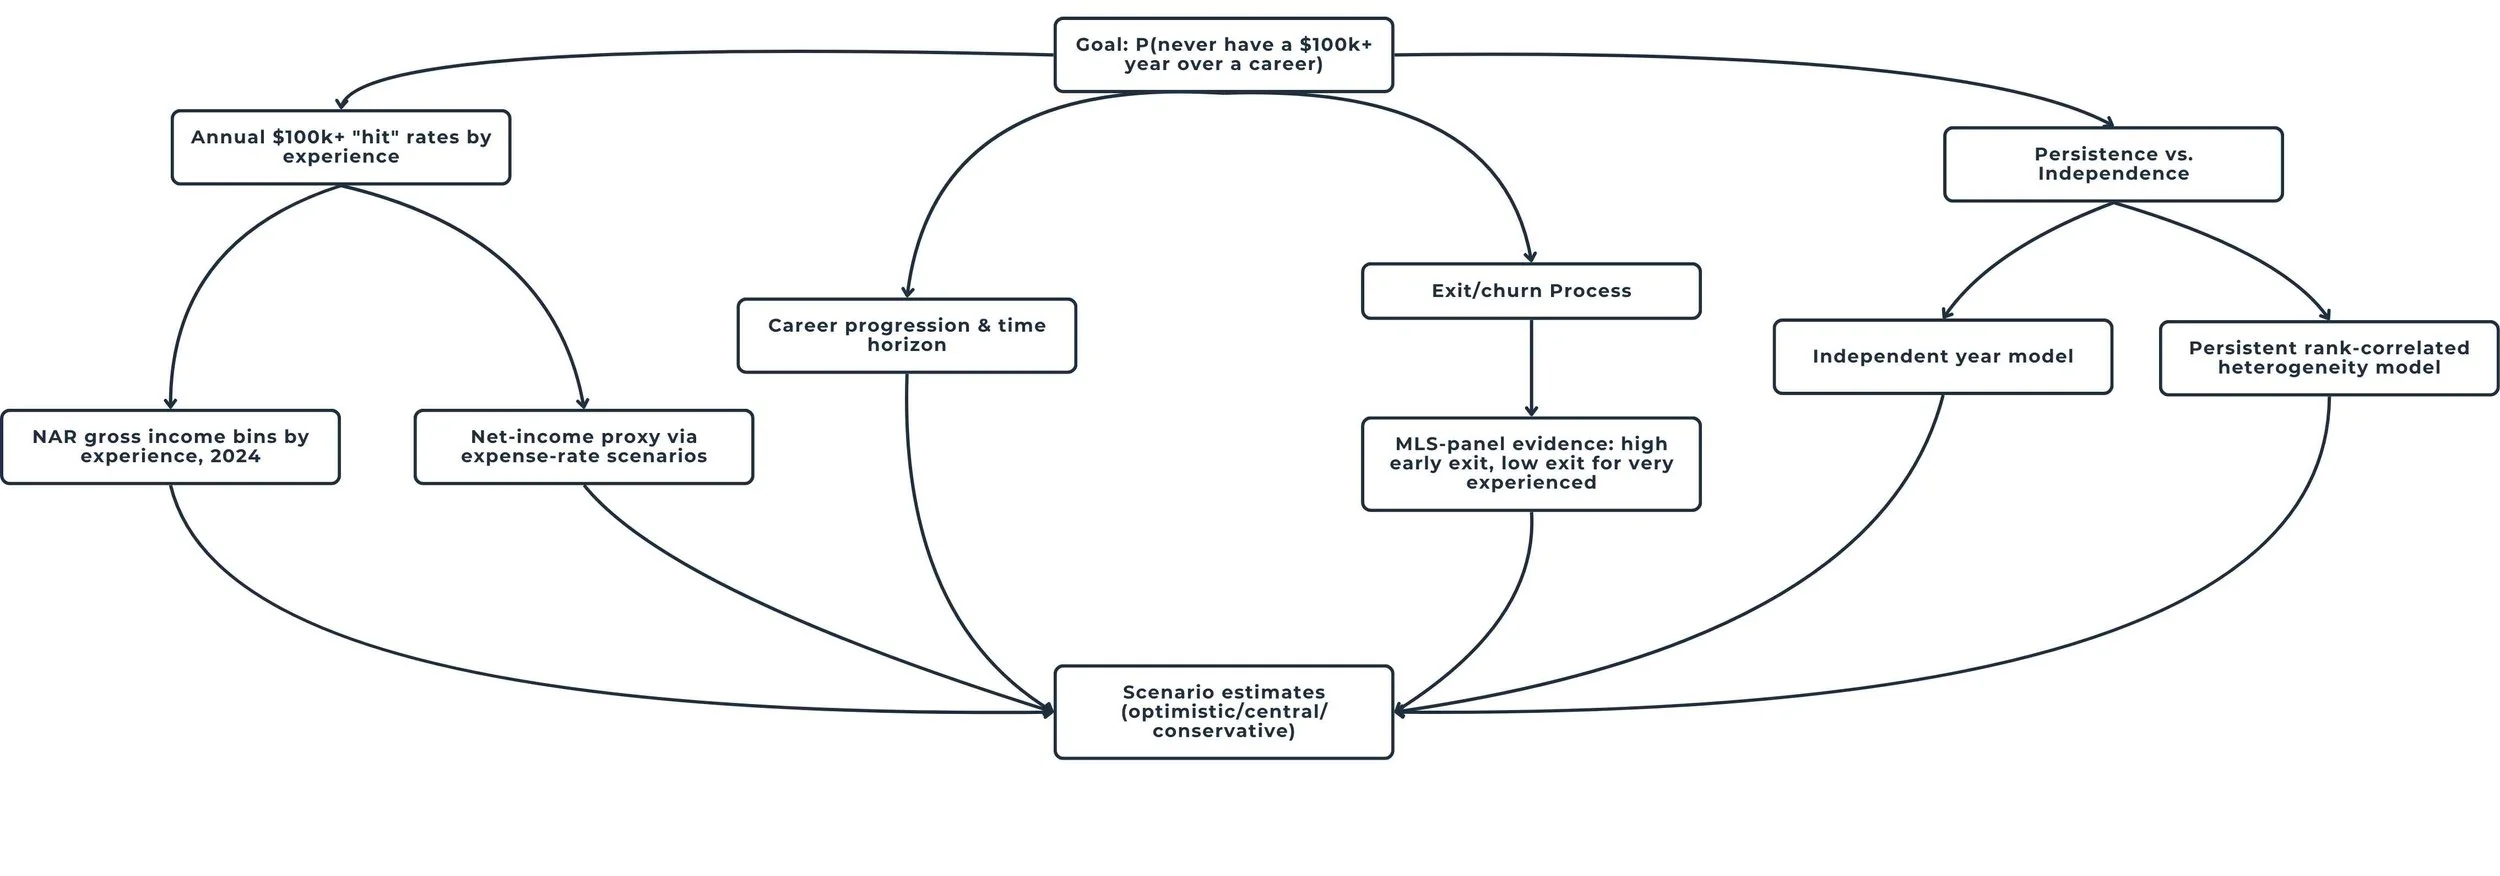
High-level structure breaking down all scenarios and assumptions based on the available data sources.
Assumptions (fully enumerated)
Outcome definition
A “hit” occurs if an agent has at least one year with income ≥ $100,000, measured as:
Gross personal income from real estate activities, using NAR’s $100–$149k and $150k+ bins (primary), or
Net taxable business income ≥ $100,000 via proxy conversion (secondary).
Population
Baseline model is calibrated to a “practicing-agent” population proxied by NAR’s member profile distributions (not all licensees).
Time horizon
Results reported for 10, 20, and 30 years.
Experience progression
Years map to NAR experience bins: years 1–2, 3–5, 6–15, 16+.
Annual hit rates (gross)
For each experience bin, annual probability of ≥$100k equals the NAR cross-sectional share in that bin for 2024: 5%, 15%, 37%, 41%.
Exit/churn rates
Exit is modeled as an annual probability of leaving the profession (no further chance to hit). Scenario ranges are anchored to MLS evidence that inexperienced exit is ~30% while highly experienced exit can be <5%.
Scenario parameterization (annual exit probabilities by experience stage):
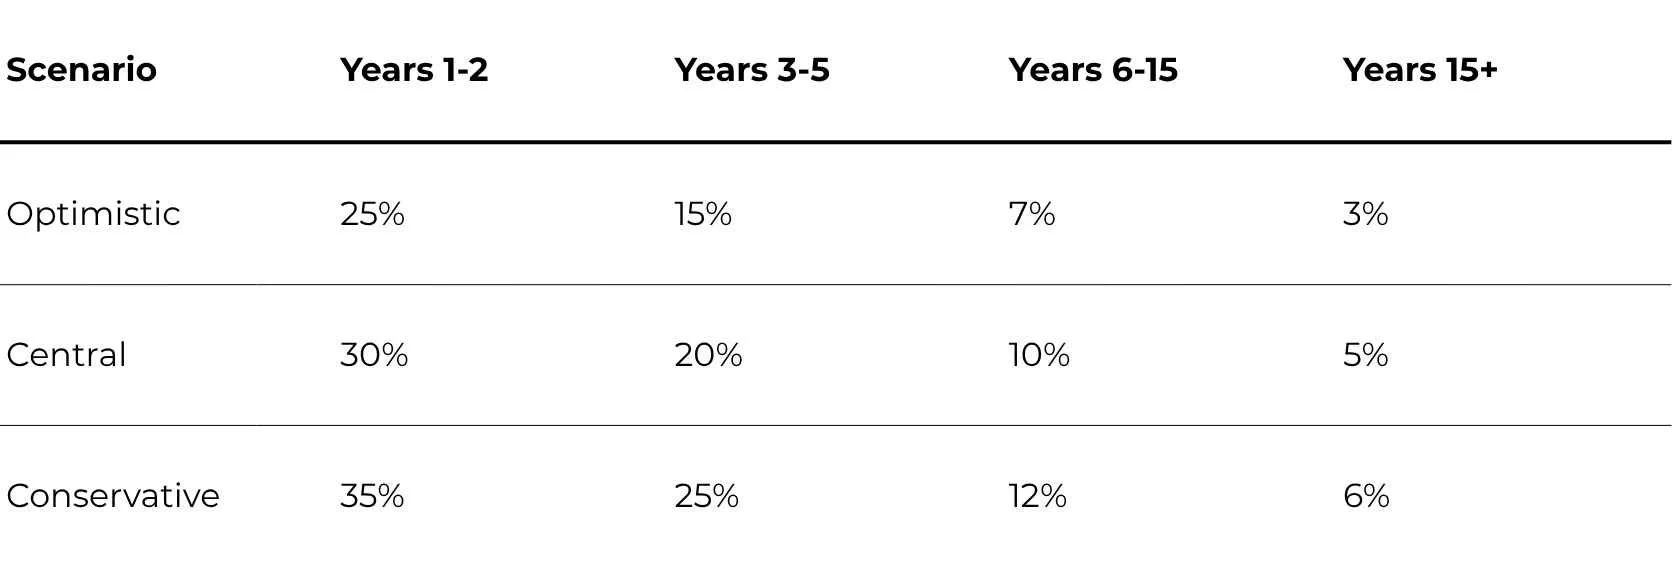
These are stylized but consistent with MLS-panel magnitudes and direction.
Persistence vs. independent annual chance
Because MLS panels show persistent stratification (top agents repeatedly high, bottom persistently low), I estimate results under two models:
Independent-year model: each year is an independent Bernoulli draw with stage hit rate p(stage).
Persistent heterogeneity model (primary): each agent has a persistent latent “rank” that maps to stage-specific hit probabilities (rank-correlated Beta distributions). This is a transparent way to encode that high performers stay high-performing as experience accumulates.
Net-income proxy conversion
Let expenses be an assumed fraction e of gross personal income (tested at 15%, 20%, 30%).
Net ≥ $100k implies gross ≥ $100k / (1 − e).
Because NAR provides bins ($100–$149k, $150k+), I assume income is uniformly distributed within $100–$149k to estimate what fraction exceeds the higher gross cutoff; all $150k+ are assumed to exceed the cutoff (valid for cutoffs under $150k, as in these scenarios).
Measurement caveat (self-employment income reporting)
Self-employed income can be mismeasured in surveys; a Federal Reserve study finds self-employed underreporting in household surveys of about 30% on average. This affects interpretation of CPS/ACS earnings-based estimates and underscores why “six figures” claims are definition-sensitive.
Timeline of data sources used
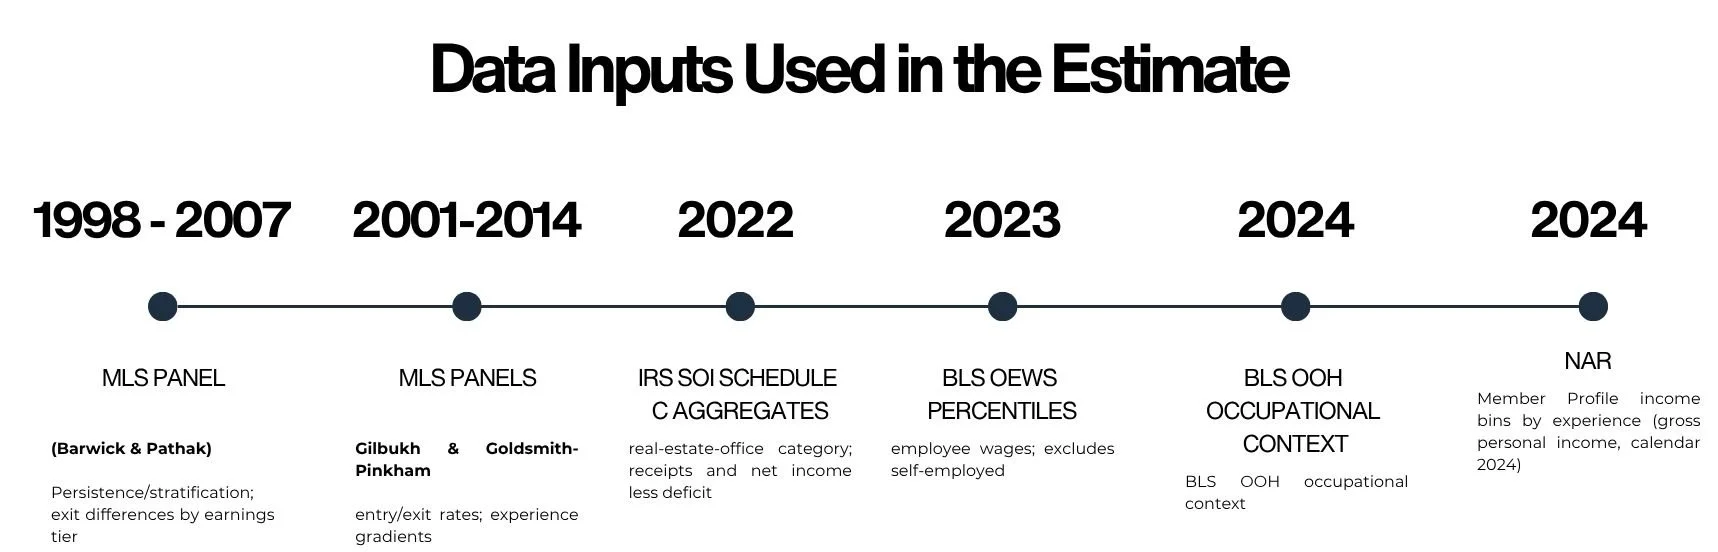
Results & Interpretation
Below are modeled estimates for an entry cohort under the persistent-heterogeneity framework, using NAR’s 2024 $100k+ shares by experience and the churn/persistence scenario bundles.
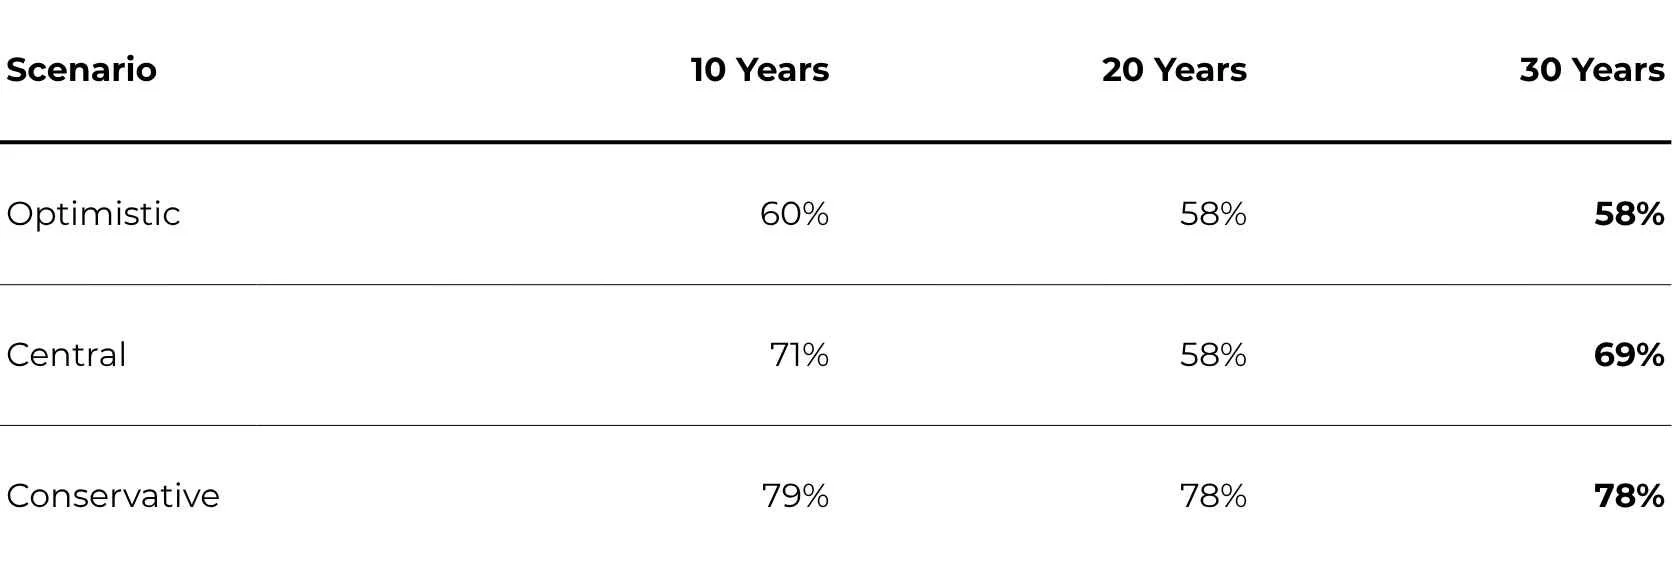
These values are driven by the combination of (a) high early churn and (b) persistent performance sorting documented in MLS panels.
Accounting for Take-Home-Pay
Under the net-income proxy conversion (net ≥ $100k), results depend on assumed expense rates.
Central scenario (30-year horizon):
Expenses 15% → ~72% never
Expenses 20% → ~73% never
Expenses 30% → ~77% never
These net-based “never” rates are higher because the gross income required to clear $100k net rises above $100k (roughly $118k, $125k, $143k respectively). Inputs for gross-bin shares come from NAR.
Accounting for Sensitivities
Persistence vs. Independent Annual Chance
Holding churn fixed at the central churn rates and using the gross definition:
Model choice10 years20 years30 yearsIndependent-year model66%66%66%Persistent heterogeneity (moderate)71%69%69%Persistent heterogeneity (strong)74%73%73%
Interpretation: if you assume outcomes are “random each year,” many long-tenured agents eventually get a six-figure year, pushing “never” down. But the longitudinal literature argues strongly against that independence assumption—top agents repeatedly outperform.
Part-time vs. Full-time
BLS states some agents work part time, and NAR reports that “real estate is only occupation” is 71% overall (and only 48% among ≤2 years).
Because NAR’s $100k+ shares are not directly split by part-time/full-time, I estimated a transparent range by assuming part-time agents are 30–70% as likely as full-time agents to have a $100k+ year and solving for an implied full-time hit rate consistent with NAR’s mixture. Under the central churn and moderate persistence assumptions, the implied full-time-only “never” share over 30 years ranges from roughly 63–67% (gross definition).
Population Discrepancies
This is the single largest driver of what number is “right.”
Using explicit proxy definitions:
NAR-like practicing agents (baseline): central ~69% never (gross, 30 years).
Active producers (proxy): define as agents earning at least $10k in a given year (since NAR shows 62% of ≤2 years are under $10k, indicating a large low-activity segment). This produces a modeled “never” of roughly 44% over 30 years (gross).
All licensees (proxy): if a large inactive/low-activity segment is included (illustrated with 35–45% “inactive” share assumptions), modeled “never” can rise to roughly 84–86% over 30 years (gross). This aligns with the empirical reality that many entrants exit quickly and many participants produce episodically.
Conclusion: 75% of Real Estate Agents will Never Hit Six Figures
The share of agents who never have a $100,000+ year is most plausibly around ~60–80% (gross definition), with a central estimate around ~70%. In terms of net taxable business income, the number is likely higher, at about 75%.
Among all licensees, including many inactive or low-activity license holders, credible modeled ranges can extend into the 80%+ region.
While there is no single public national longitudinal income panel that can be cited independently, this conclusion is derived from integrating the existing data to conclude how many agents hit six figures over the lifetime of their careers.